
Energy Scan: your fleet, your site and the grid, calculated in detail
The scan combines your trips with the energy use of your building, your grid connection and the output of solar panels. For a full year, in detail. You see what electrification costs and delivers, and where the bottlenecks are.
Request a scan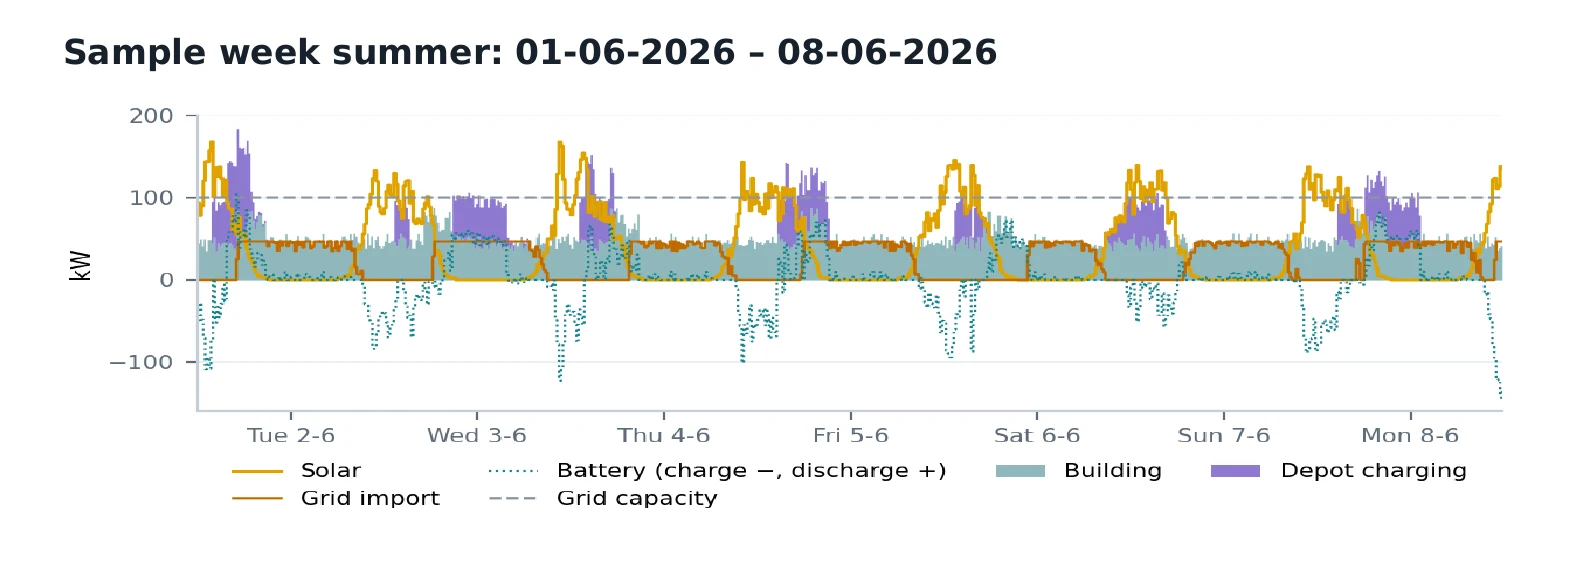
The questions the scan answers
How many electric trucks fit today?
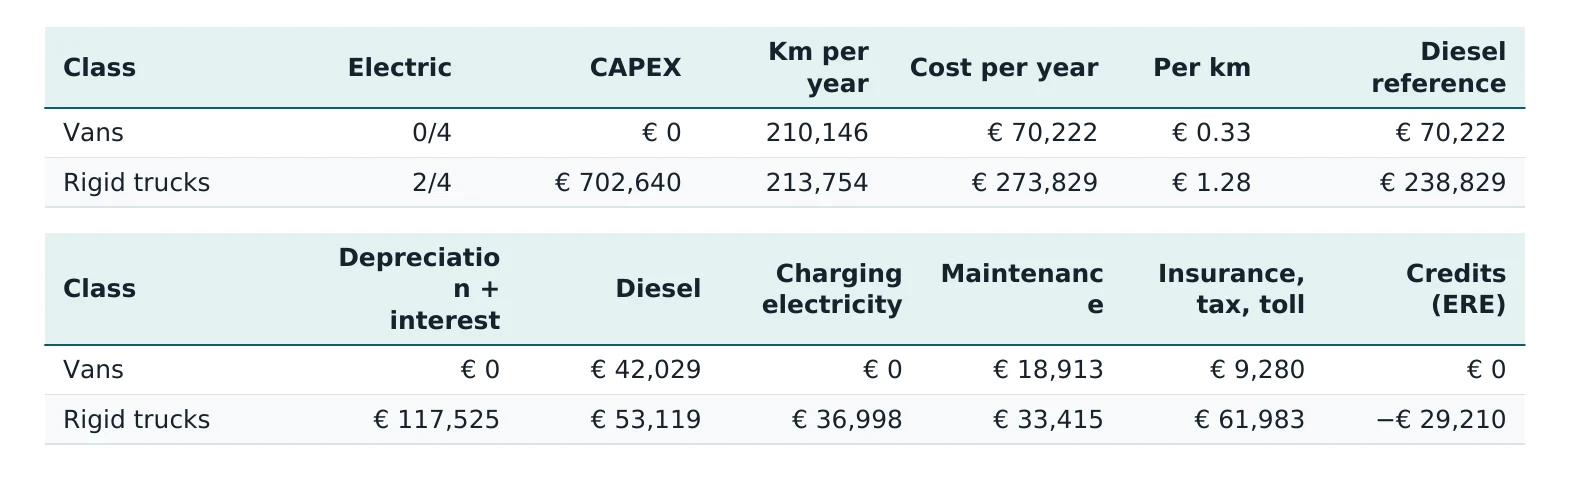
Per vehicle and per trip: can it be charged at the depot, does it need a top-up on the road, or does the trip not fit (yet)? Including higher consumption in winter.
Is the grid connection large enough?
Whether it fits within your current connection, with extra time-of-use capacity or smart charging, or whether a grid upgrade is needed. And what that costs.
What does a battery deliver?
Peak shaving, charging when dynamic prices are low and storing solar power for the evening. With the investment alongside.
What do solar panels add?
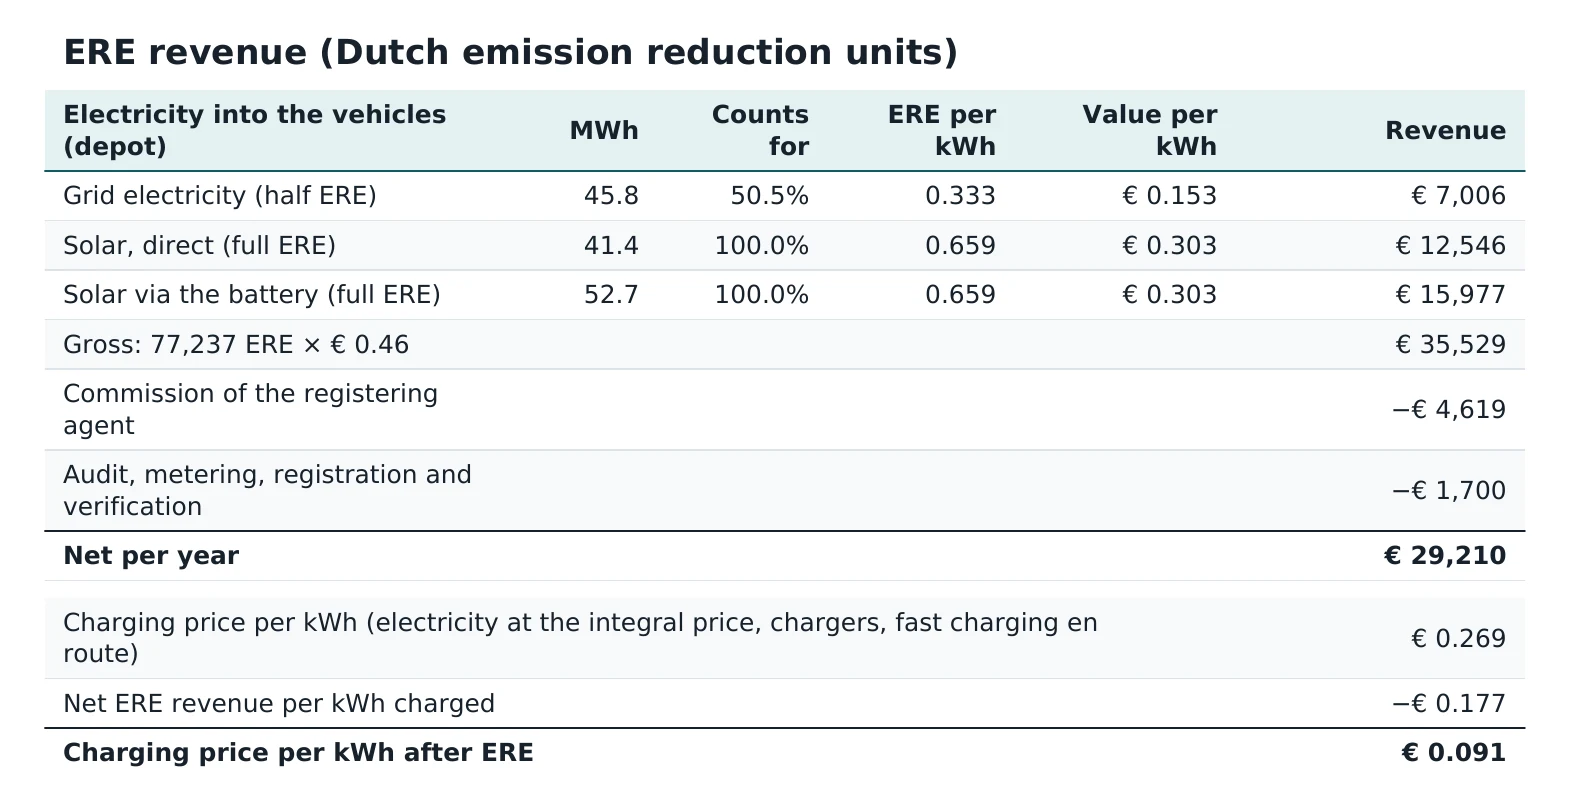
How much solar power you use yourself, what you export or have to curtail, and what that means for your price per kWh.
What you get
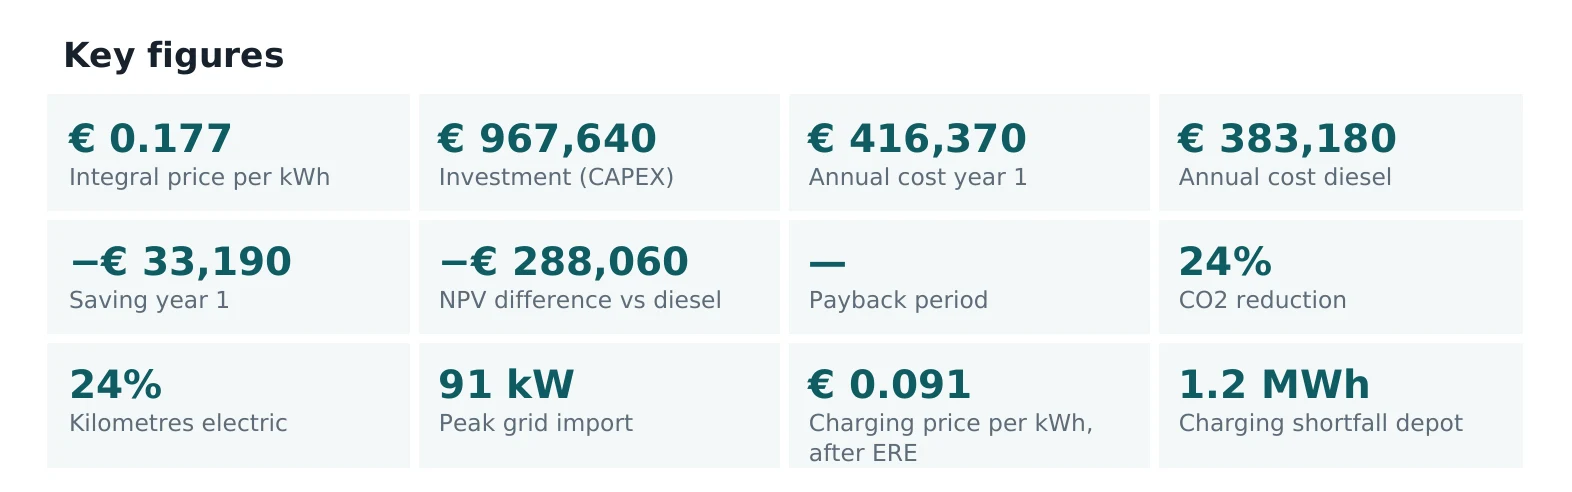
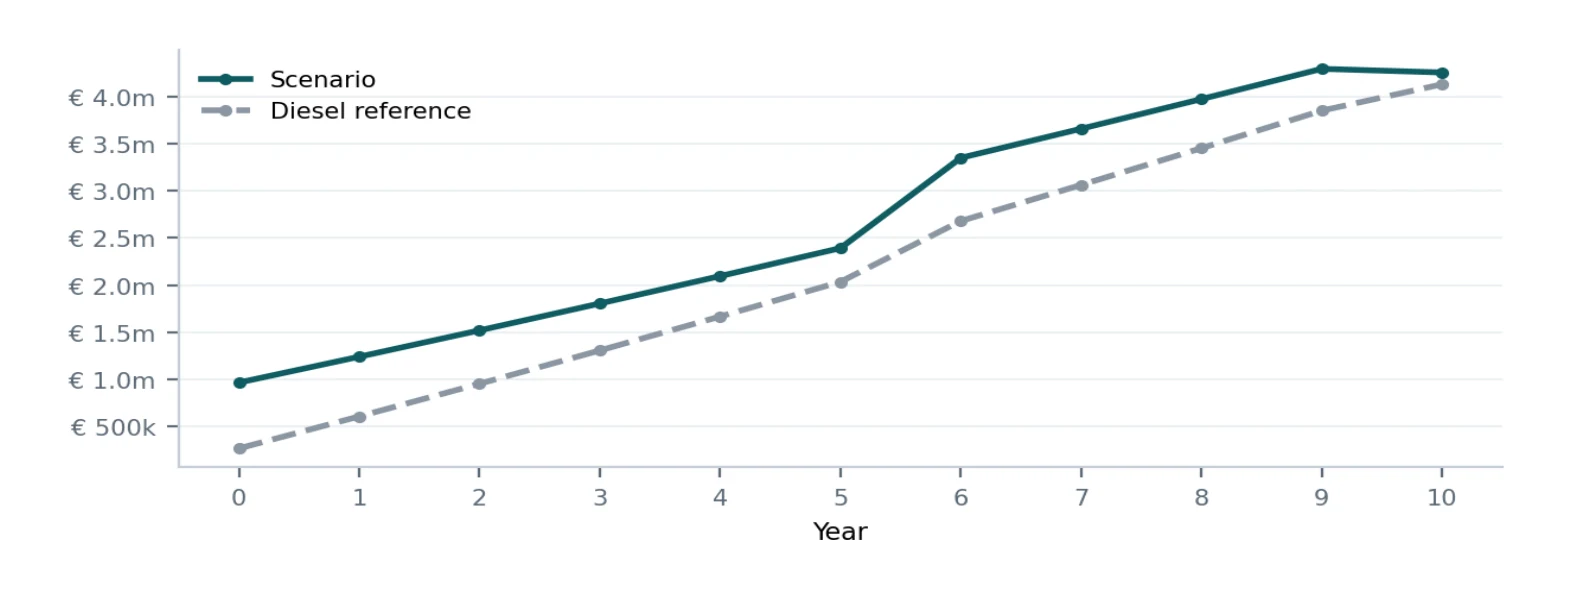
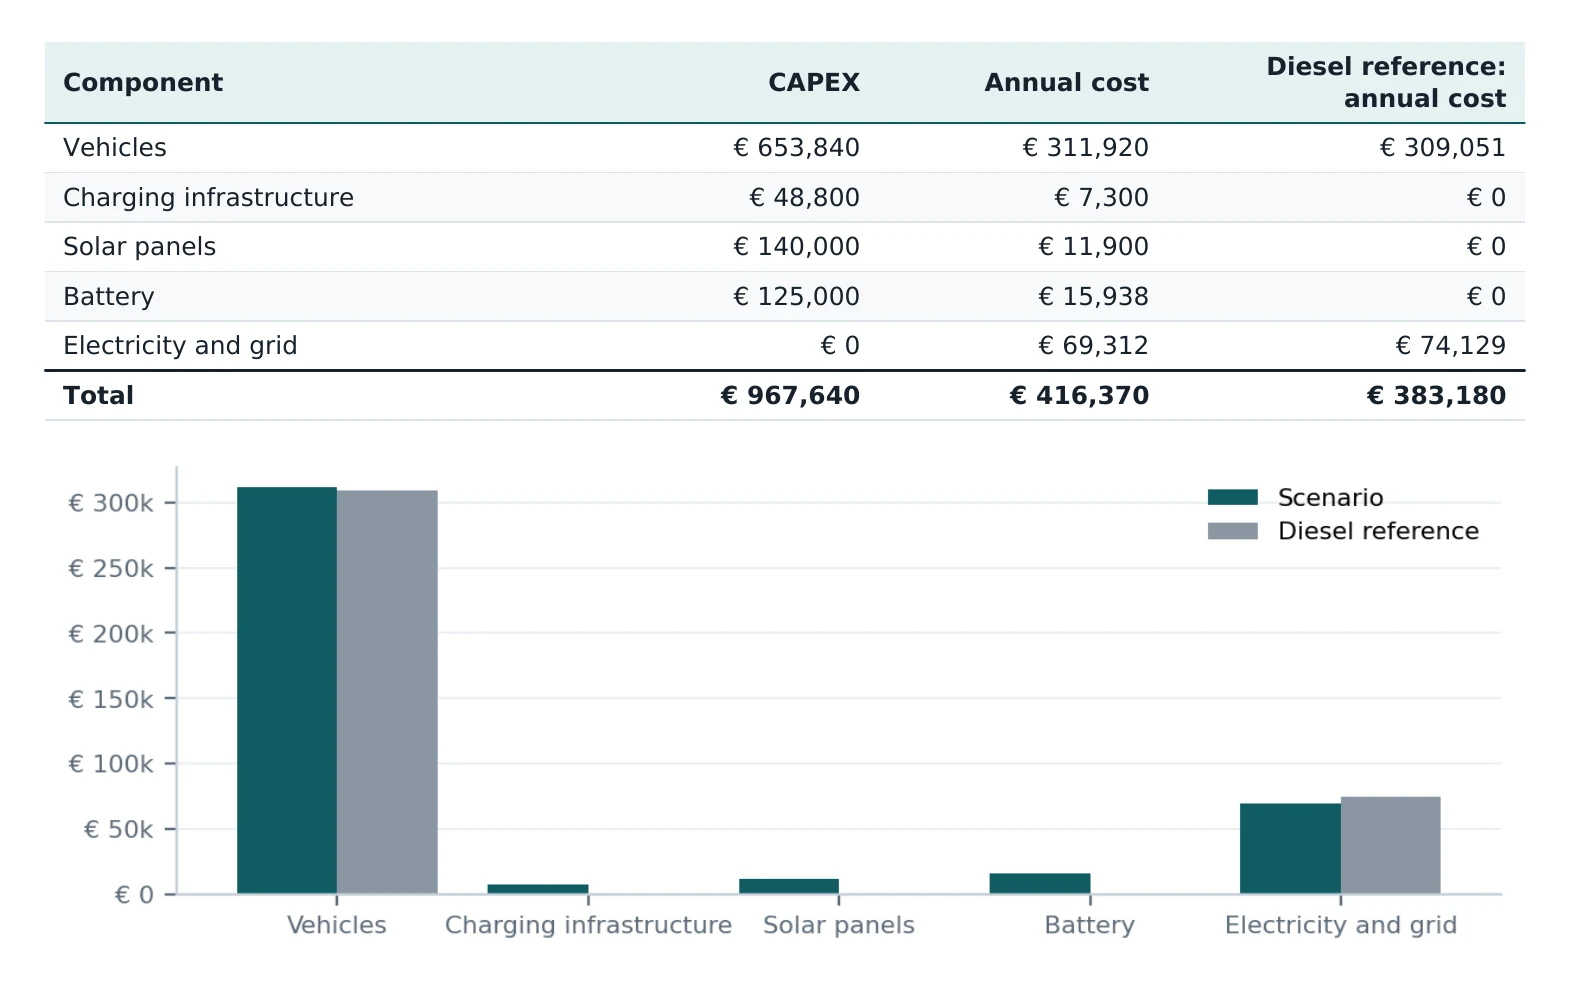
A calculation of your current situation and of the scenarios you want to compare. For example two or six electric trucks, with or without a battery, or with a larger grid connection.
Two ways to start
Quick scan
A first indication with little data. Useful to find out whether a closer look is worthwhile.
- Number and type of vehicles, average distance per day
- Size of your grid connection and your annual consumption
- Result based on standard profiles, discussed in a call
Full Energy Scan
With your own metering data and trips, for a well-founded decision.
- Your current situation and the scenarios you want to compare
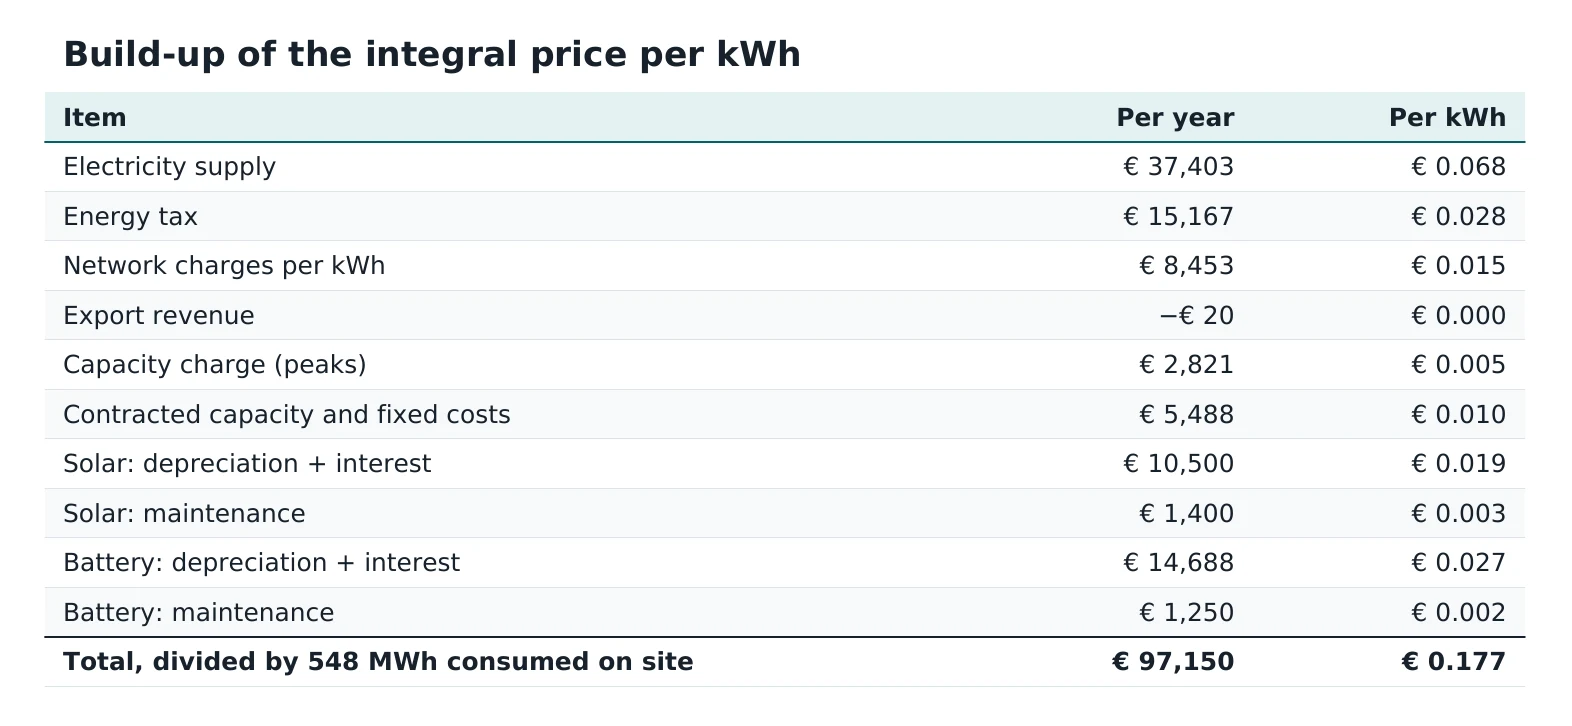
- Detailed energy flows, costs per component, ten years ahead
- Discussion of the results, a report and an Excel file
What data is needed
- Electricity use of your connection over a year, as detailed as available: quarter-hourly, half-hourly or hourly data all work.
- Trips per vehicle: an export from your planning system (TMS) or fleet system with date, start and end time and distance. Driver names are not needed.
- Your fleet and which vehicles you want to replace.
- Grid connection and contract: contracted capacity, fixed or dynamic price.
- Optional: solar panels or the available roof space.
Metering data works differently in every country. This is where you can usually request it:
| Country | Usually available | Request from |
|---|---|---|
| Netherlands | quarter-hourly data | grid operator or metering company |
| Belgium | quarter-hourly data (digital meter) | grid operator, such as Fluvius, ORES or Sibelga |
| Germany | quarter-hourly load profile ("Lastgang") for larger consumers | grid operator or metering point operator |
| France | 30-minute data ("courbe de charge") | Enedis |
| United Kingdom | half-hourly data | energy supplier or network operator |
| Nordic countries | hourly or quarter-hourly data | national datahub or grid operator |
Not sure where to look? We'll figure it out together.
How it works
Introduction
We discuss your question, your fleet and your plans.
Share your data
You send metering data and trips via a secure link. We agree on confidentiality.
Calculation
I calculate your current situation and the scenarios that matter to you.
Review
We go through the results together. You keep the report and the Excel file.